
Ah! Oz, where kangaroos deliver Easter eggs cuz’ rabbits are puny & where beer flows from town fountains … and no nukes! Australia’s fairy tale image did take a small dip last week after the USA and China signed a major deal to combat pollution together which brought back to the surface the country’s abysmal performance on greenhouse gas and the likes. I suppose that’s what sparked your interest, son.
http://www.smh.com.au/federal-politics/political-news/uschina-deal-on-greenhouse-gases-thrills-bill-shorten-but-does-australia-care-20141114-11mm03.html
https://au.news.yahoo.com/a/25519009/climate-change-academics-call-for-australia-to-cut-greenhouse-gas-emissions-by-15pc-by-2020/
http://www.theguardian.com/world/2014/nov/17/angela-merkel-pressures-australia-to-reveal-its-greenhouse-gas-targets et al.
Roughly, Australia produces 1,3 % of the world’s greenhouse gas emissions between France and the UK, both with nearly 3 times more people.
Australia is not in the 50 most populated nor third world nations; why would it score so poorly in greenhouse gas emissions? The population in Australia is near 21 million urban and 2.5 million rural out of 23.6 total. Not only are the towns ten times the weight of the country but the disparity is also geographical with almost all the people in the East. And yet the most striking ratio is that of people to space, not quite 3 persons per square kilometer for 53rd in population. National ranking goes up to tenth by economy ( Gross Domestic Product PPP per capita ) and 6th by size. Those 23.5 million people over 7.7 million square kilometers give the third rank worldwide for low density of population at 3 persons per SqKm ( only Namibia and Mongolia being verifiably emptier ). That means OZ is one big bubble which we will now check with maps.
First from the Botanic Gardens : https://www.anbg.gov.au/aust-veg/veg-map.html
Vegetation is richer on the east coast up and down with farmlands extending in the crescent plus Darwin and Perth regions up center and low left respectively. Correspondingly, each dot giving a 1,000 folks, this is where they live :
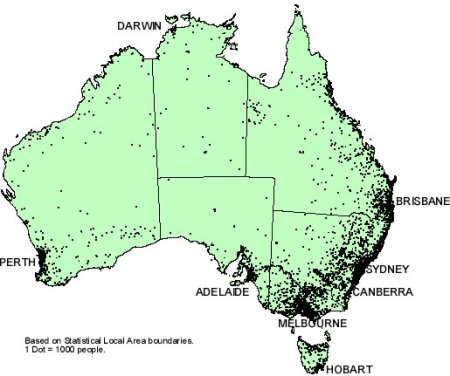
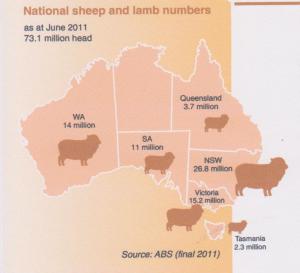
I’m sure you have an idea already but to be certain of what we are examining :
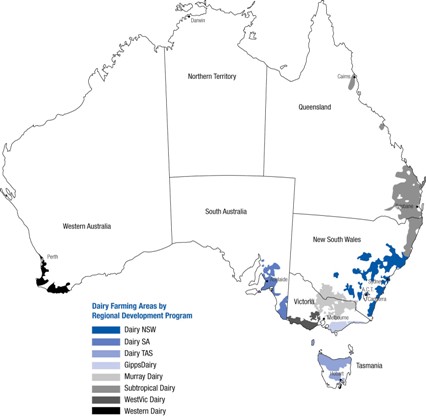
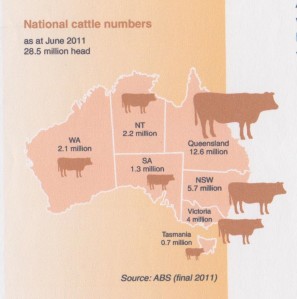
Cows.
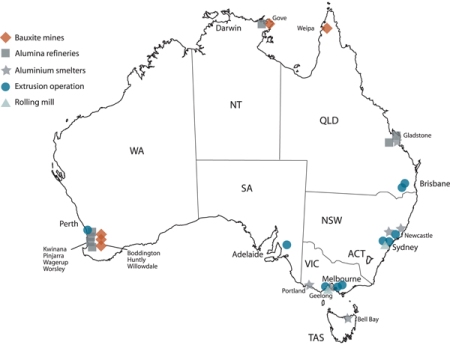
Aluminum mining and processing.
In cattle, beef spreading more than sheep recently :
About the only activity spread all over is the coast is of course aquaculture, quite active down under but again not in the central shrub deserts. Which over all carries the idea is that Australia has an empty middle.
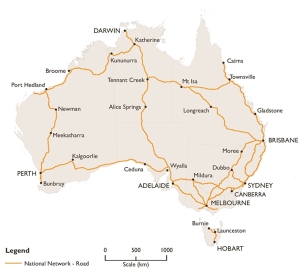
Roads and trains show that to be true :
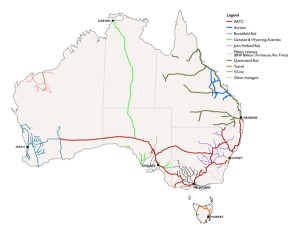
And if you want confirmation here are the massive land’s sea trade routes :
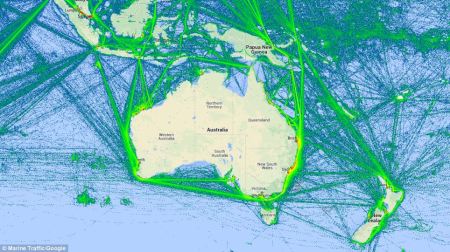
From this excellent article on maritime trade in general : http://www.dailymail.co.uk/sciencetech/article-2636152/Watch-worlds-ships-sail-planets-oceans-REAL-TIME-Interactive-map-reveals-crowded-routes-taken-worlds-vessels.html
After so many confirmations, let us offer this small restraint, there are actually a lot of interesting things in this great big bubble. Special minerals can be found there of which I will give one example :
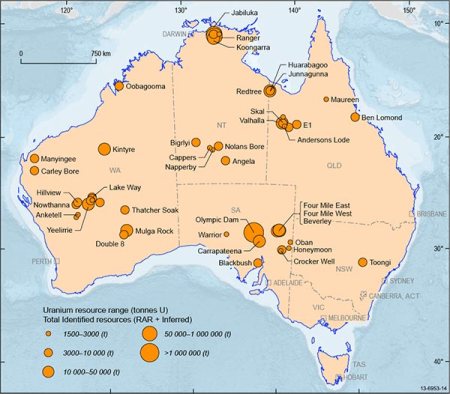
Uranium reserves.
and direct you for more to the ad hoc government of Australia site : http://www.ga.gov.au/data-pubs/data-and-publications-search/publications/aimr/uranium
Gold, Tungsten, Iron ore, you name it is available and all are located in the center or West, with the mines slowly pushing North from the South coast. Thorium, another nuclear process element is also available and although Australia has vowed to remain nuke free, the mining and selling of those will occur. All of which resources need to be hailed from the inhospitable mainland and brought to the coast.
That in essence is what Australia suffers from that makes it such a polluter, you see boy : gigantism! To give you an example far from industry, simply applying a better management to brush fires, considering the vast expanses concerned, reduced the country’s emissions by half a billion tons last year.
http://www.abc.net.au/environment/articles/2014/11/07/4122974.htm
Of all the sources, energy is the biggest polluting sector with almost three fourths of the total, 50 just for electricity and the rest between mining and transporting the stuff. Processing it by comparison only ranks at 6% but agriculture stands at 16. So that it is not so much what they do as how they do it and that is directly linked to the sheer size of Australia, its geography, climate and ensuing human dispersal. For sure, things could be better. For instance, the mining as I said is growing and will keep at it. It brings along the energy mega part up too as well.
http://www.wwf.org.au/our_work/people_and_the_environment/global_warming_and_climate_change/science/australia_greenhouse_gases/
As far as scale, little can be done short of splitting OZ in two thus going down the list of baddies for each but the ratio to population will still be there. In essence, Australia is a developing country, not because it is entering modern stage but since it is still growing on the inside. Just for that. the numbers will keep going up. There is still a lot of saving the environment that can be done though but it calls for a will to preserve the future by minimizing the impact of development of the outback. And there, the best ideas will not be coming from giant lands. But that is another story for a later Post.
For now, good night, Tay.
